Test coverage analysis with GCOV
This article has been migrated from my original post at embeddedinn.wordpress.com.
Any large code base needs to be incrementally tested for each release for regressions and bugs. When the code base grows, manual testing fails to meet the requirements and we have to move into automated systems for testing. Once a test is written, we have excellent continuous integration systems like Jenkins or Cruise Control to validate the tests against any changes made on the code. However, the CI system is only as effective as the test. If the test does not cover all use cases, then there is no point in running the tests in CI.
This article intends to illustrate the use of ‘gcov’ to estimate the dynamic coverage of a test. The article speaks solely from the viewpoint of a C programmer working on a Linux PC (or similar systems)
What is coverage?
All large scale, usable C code is written in the form of blocks of code enclosed in functions. A block can be a set of simple execution statements or a logical branch.
The ideal test code should logically call all the functions and execute all statements in the blocks. The percentage of lines of actual code that gets executed when a test code runs is called the coverage of the test code. More the number of lines of code that is tested, less is the probability to get a last minute surprise bug.
There are two types of coverage analysis that is possible.
Static code coverage analysis is done by analyzing the test code and the actual code to primarily estimate the function call coverage. Static code coverage analysis is much faster and simpler since the generated object file need not be executed. This is particularly handy in the case of small scale embedded systems.
Dynamic code coverage analysis is much more elaborate and requires the test code to be executed on the target. It also requires the object file to be generated with special compilation options. However, it gives much more detailed analysis of how effective the test is.
For obvious reasons, it is not practical to manually compute the coverage of a test code. Thus we have some tools that can compute the coverage of our test code for us. We will now look into the details of how ‘gcov’ can be used for dynamic code coverage analysis.
GCOV
As per Wikipedia, Gcov is a source code coverage analysis and statement-by-statement profiling tool. Gcov generates exact counts of the number of times each statement in a program is executed and annotates source code to add instrumentation. Gcov comes as a standard utility with GNU CC Suite (GCC)
Gcov provides the following details:
- How often each line of code executes
- What lines of code are actually executed
- How much computing time each section of code uses
Getting Started With GCOV
When using gcov, you must first compile your program with –coverage GCC option.
This tells the compiler to generate additional information needed by gcov (basically a flow graph of the program) and also includes additional code in the object files for generating the extra profiling information needed by gcov. These additional files (.gcno) are placed in the directory where the object file is located.
Once the object file is generated, execute it once to get the profile file (.gcda)
Once we have the gcna and gcda files , we can now run gcov.
To illustrate the usage of gcov, we will consider a very minimal library (lib.c) and it test suite (test.c) .
lib.c
int libfn1()
{
    int a =5;
    a++;
    return (a);
}

int libfn2( int b)
{
    if (b>10)
    {
        libfn1();
        return(b);
    }
    else
    return(0);
}
test.c
#include <stdio.h>
extern int libfn1();

int main ()
{
     libfn1();
     libfn2(5);
}
Compilation command for the test code :
gcc --coverage lib.c test.c –o test
This will generate the following files:
lib.gcno– library flow graphtest.gcno– test code flow graphtest– test code executable
Now, execute the test code object file. This will generate the following files
lib.gcda– library profile outputtest.gcda– test code profile output
Now we have all the inputs required for gcov to generate the coverage report. To generate the coverage report, run the following command
gcov -abcfu lib.c
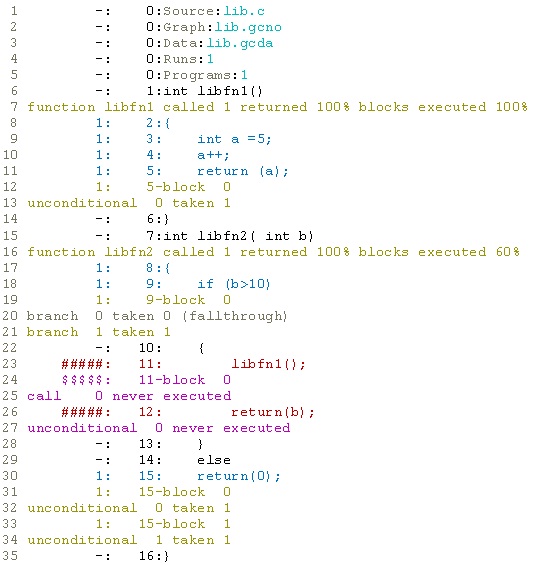
Coverage summary will be displayed as below when gcov finishes execution:
Function 'libfn1'
Lines executed:100.00% of 4
No branches
No calls
Function 'libfn2'
Lines executed:60.00% of 5
No branches
No calls
File 'lib.c'
Lines executed:77.78% of 9
Branches executed:100.00% of 2
Taken at least once:50.00% of 2
No calls
lib.c:creating 'lib.c.gcov'
Detailed coverage report will be available in the lib.c.gcov file generated by gcov
Each block is marked by a line with the same line number as the last line of the block and the number of branch and calls in the block.
Each function is preceded with a line showing the number of times the function is called, number of times it returns and the percentage of function blocks that were executed.
Each line of executable code contains the number of times the line was executed and the actual source code line number. Any line that was not executed will have ##### in place of the execution count. Blocks that are not executed will have $$$$$ in place of the execution count.
The command line option summary for gcov is given below:
| -h, –help | Print this help, then exit |
| -v, –version | Print version number, then exit |
| -a, –all-blocks | Show information for every basic block |
| -b, –branch-probabilities | Include branch probabilities in output |
| -c, –branch-counts | Given counts of branches taken rather than percentages |
| -n, –no-output | Do not create an output file |
| -l, –long-file-names | Use long output file names for included source files |
| -f, –function-summaries | Output summaries for each function |
| -o, –object-directory | DIR\FILE Search for object files in DIR or called FILE |
| -p, –preserve-paths | Preserve all pathname components |
| -u, –unconditional-branches | Show unconditional branch counts |
Visualizing results with LCOV
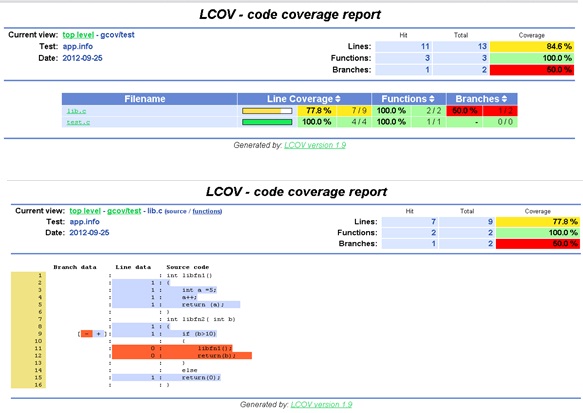
The Linux testing project (LTP) has come up with a tool called lcov that provides a more user-friendly graphical visualization of the gcov output. It generates html files and integrates well with web based CI systems.
To make lcov generate html reports for you, give the following commands once the gcno and gcda files are generated.
lcov --directory . –zerocounters
lcov --directory . --capture --output-file app.info
genhtml app.info
The lcov reports seen from a browser is shown in the screenshots below.
Cross Profiling
This section is adapted from the GCOV manual :
As we have seen so far, running the program to be profiled will cause profile output to be generated. For each source file compiled with the –coverage option, a .gcda file will be generated in the object file directory. This places a restriction that the target system should have the same directory structure. (The program will try to create the needed directory structure, if it is not already present).
As per the gnu GCOV documentation, redirection can be done with the help of two execution environment variables.
GCOV_PREFIX: Contains the prefix to add to the absolute paths in the object file. Prefix can be absolute, or relative. The default is no prefix.GCOV_PREFIX_STRIP: Indicates the how many initial directory names to strip off the hardwired absolute paths. Default value is0.
Note: If GCOV_PREFIX_STRIP is set without GCOV_PREFIX is undefined, then a relative path is made out of the hardwired absolute paths.
For example, if the object file /user/build/foo.o was built with -fprofile-arcs, the final executable will try to create the data file /user/build/foo.gcda when running on the target system. This will fail if the corresponding directory does not exist and it is unable to create it. This can be overcome by, for example, setting the environment as GCOV_PREFIX=/target/run and GCOV_PREFIX_STRIP=1. Such a setting will name the data file /target/run/build/foo.gcda.
You must move the data files to the expected directory tree in order to use them for profile directed optimizations (–use-profile), or to use the gcov tool.


Leave a comment